TCP
Traffic Analyzer
Introduction
Yconalyzer
is
a tool to monitor and analyze TCP connections on a particular TCP port.
You can use yconalyzer to get answers to questions like:
- How many connections lasted
more (or less) than X milliseconds?
- How many connections needed
more than N attempts to succeed?
- What is the distribution of
connection duration or throughput for
connections in which the server or client sent more than N bytes?
- What specific IP addresses
and ports had connections that lasted
between 50 and 100 milliseconds long?
Yconalyzer can be invoked in one of three modes:
- Capture mode (e.g.
yconalyzer
-p 25 -w smtp.pcap
)
- Analyze mode (e.g.
yconalyzer
-p 25 -r smtp.pcap
)
- Live traffic analysis mode (e.g.
yconalyzer -p 25)
When yconalyzer is invoked in capture mode, it captures relevant
packets and saves it into the file specified by the -w
argument. If the -t
<nseconds>
option is not specified, yconalyzer captured
packets for 60 seconds.When invoked in the analyze mode, it reads
packets that have
already been captured using yconalyzer (or using tcpdump, see section
below) and presents statistics about the connections. These modes are
useful for debugging performance or other problems on a machine (client
or server).
In the Live
traffic analysis mode, yconalyzer captures packets and prints out the
statistics of the connection packets captured. This mode is most useful
for periodic monitoring of of connections on a machine (e.g.
via cron
jobs). The -r
option can be used to pipe
the output of yconalyzer to other sed,
awk
or shell scripts that
may store the results, raise alarms, etc.
The -p
option is
mandatory for all invocation modes.
Yconalyzer captures packets (or read captured packets from files) using
libpcap.
It
captures a minimal set of TCP packets off the network interface using BPF.
Yconalyzer captures only those TCP packets that have the SYN,
FIN
and RST
bits set in the TCP headers (see
RFC
793).
These should be much smaller in number than the other packets of the
connection. Therefore, capturing this subset of packets and processing
them should not impose a large overhead.
Another common utility that
uses libpcap is tcpdump.
Yconalyzer is fully
compatible
with tcpdump.
It can
analyze pcap
files captured
by tcpdump.
Yconalyzer writes pcap files in the that can be read by tcpdump
as
well. In fact, the following two commands are equivalent:
tcpdump
-w http.pcap '(tcp port 80)&&((tcp[tcpflags] &
(tcp-syn|tcp-fin|tcp-rst)) != 0)'
yconalyzer -w
http.pcap -p
80
Both of these commands capture connection control packets of
TCP
from/to port 80 into a file called http.pcap
(the argument to the -w
option).
Note that this filter will include packets belonging to incoming as
well as outgoing connections on a machine. In other words, the packets
captured will include those connections in which the machine acts as a
server on port 80, as well as those in which the machine is a client
connecting to port 80 on other machines.
Once packets are captured using any of the commands as described above,
you can run yconalyzer in the analyze mode to analyze the data. As in:
yconalyzer
-r http.pcap -p 80
Using
additional filters
The tcpdump command allows you to specify filters at the end of the
command (such as the one illustrated). You can use additional filters
to the yconalyzer command as well. Yconalyzer accepts any such filter
that tcpdump accepts. Using additional filters can help when the CPU is
so busy on the machine that even the restricted filter used by
yconalyzer causes spikes, or causes yconalyzer to drop some packets
(yconalyzer reports the number of dropped packets at the end of the
run).
For example, to capture only
incoming connections to port 80 on a host called proxy.foo.net (and
ignore any connections that proxy.foo.net to initiate to port 80 on
other hosts), you can use the following filter:
yconalyzer
-w http.pcap -p 80 '(dst port 80 and dst host proxy.foo.net) or (src
port 80 and src host proxy.foo.net)'
Read the tcpdump
man
page for details on constructing
BPF filters.
You can also use filters when running yconalyzer with the -r
option,
if that helps in analysis.
Performance
Overhead
When designing monitoring subsystems it is important to make sure that
they do not take up more resources than the application that is being
monitored, thereby skewing the measurements. The best way to monitor
the performance overhead of yconalyzer is to run the top
command.
when yconalyzer is running. Most likely, you will not see it in the
radar at all. Another way to tell
if yconalyzer could not keep up with the traffic on the machine is the
message that it prints at the end of the run, as below:
20545
Packets received
0
Packets dropped
As long as the number of packets dropped is reported to be zero, you
can be sure that yconalyzer has captured all packets of interest. Even
if yconalyzer reports dropped packets, you can analyze the captured
files -- just that not all connections will be included in the
analysis. It also means that your machine is running out of CPU.
Therefore, any measurements you make may be skewed, and therefore may
not reflect the true performance characteristic of the machine.
If you notice that yconalyzer is reporting dropped packets
all the time, you should consider specifying additional filters
in the
command line.
The narrower the filter, the lower the chances of dropping packets
during capture.
Another alternative is to capture only some fraction of the
connections. See example.
Presentation
When yconalyzer is invoked without specifying any special options, the
output looks as below:

The first several lines of output display some general information
about the information captured. Most of these are self-explanatory. Of
most interest may be the lines that display the average number of SYNs
taken to establish a connection (you want 1.0 in the ideal case), the
number of connections terminated by RESET (depending on the way TCP is
used by the upper level protocol, you want this number to be 0 as
well), and also the line showing the distribution of SYNs. This line
shows how hard the clients had to work to get connected to the server.
In the example shown, 2233 clients got a connection in one attempt, 17
of them needed two, and 1 needed three attempts to get to the server.
Depending on whether you run yconalyzer on the client side or the
server side, you can draw appropriate conclusions. The next set of
lines is in a tabular format, each line corresponding to a "bucket".
Buckets
By default, yconalyzer counts places each connection in a bucket (e.g.
a connection that lasted 25 milliseconds will be placed in the 20-40
bucket), and displays the number of connections and the average client
and server data size, and average throughput for all connections within
that bucket. By default, yconalyzer reports data for 20 buckets, with a
20 ms bucket size.
You can specify a different bucket size using the -s
option,
or a different number of buckets using the -n
option.
By default, yconalyzer uses the connection duration as the measure for
a bucket. You can change this behavior with the -C
option to
use the number of bytes sent by the server as the bucket measure, or
the -S
option to use the
number of bytes sent by the server as the bucket measure, or -P
for using
throughput as the bucket measure. Here is a partial output that uses
the number of bytes sent by the client side as the measure of buckets:
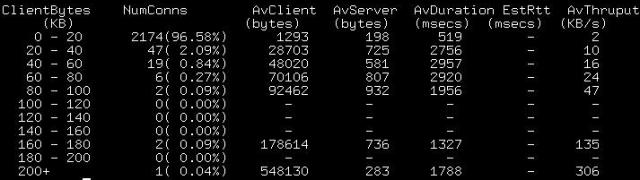
As before, you can vary the bucket size or number of buckets using the -n
or -s
option.
Filtering
by Volume
In the normal analysis mode, yconalyzer considers all
connections on the port (along
with any command line filters specified, of course). It is sometimes
useful to eliminate certain connections by client or server volume
(i.e. number of bytes sent by client or server) for analysis. You can
use the options -X, -x, -Y, and -y for such filters:
- -X
<nbytes>:
Consider only those connections in which server sent less than <nbytes>
- -x
<nbytes>:
Consider only those connections in which the client sent less than <nbytes>
- -Y
<nbytes>:
Consider only those connections in which the server sent more than <nbytes>
- -y
<nbytes>:
Consider only those connections in which the client sent more than <nbytes>
Connection
Details
While yconalyzer can give you summary information about the
connections, it can also help you drill down into a specific
connection. For example, in the default
output, you can see that there
are 19 connections that lasted
between 0 and 20 ms in duration. If you want to identify these
connections, you can run the same yconalyzer command with the -D
0 option.
Yconalyzer will output extra information about each of the 19
connections making up the 0-20 bucket. A sample output is as below:

Note that there are 19 extra lines in the output, one for each
connection in the bucket. You can then cut and paste any of these lines
to the tcpdump command to get a packet trace for that connection. As in:
tcpdump
-r smtp.pcap host 68.142.202.247 and host 74.52.168.160 and port 42834
Try it!
Other
options to explore
Yconalyzer installs with a man page that describes all the options
supported. It also prints a brief summary of options when invoked
without the mandatory -p
option. Here are some other options to try out:
- -c
<nattempts>
: Print the connections that took more than or equal to <nattempts>
to establish
(these details are printed before
the summary and buckets).
- -I <time> :
Consider only those packets that are
timestamped newer
than the
time specified. Time can be specified in HH:MM:SS or in
YYYY-MM-DD.HH:MM:SS formats. This option is useful when a capture spans
a longer time, but we are only interested in looking at connections
that happened after a certain time.
Usage
Examples
Capture:
All connections for ten minutes
To capture all connection control packets (i.e. those with SYN, FIN or
RST bits set) on port 80 for both incoming and outgoing connections for
10 minutes, and save the packets in a file http.pcap for future
analysis:
yconalyzer
-w http.pcap -p 80 -t 600
Capture:
Only incoming connections
Unless an appropriate filter is specified, yconalyzer captures all
connection control packets. On
some servers, it may be that there are also connections initiated from
the server to (say) a monitoring node periodically. Or, it may be that
the server in question is a proxy, and we only wish to analyze the
incoming traffic. Here is one way to capture only those connections on
port 80 in which the machine (say, foo.bar.net) acts as a TCP server:
yconalyzer
-w http.pcap -p 80 '(dst host foo.bar.net and dst port 80) or (src host
foo.bar.net and src port 80)'
Capture:
Only outgoing connections
In order to capture only outgoing connections on port 80 on a machine
foo.bar.net:
yconalyzer
-w http.pcap -p 80 'src host foo.bar.net and dst port 80) or (dst host
foo.bar.net and src port 80)'
Capture:
Sample 25% of
incoming connections
Sometimes, capturing all connections on machine may cause yconalyzer to
drop packets (see Performance Overhead).
In cases where a server is fielding connections from clients spread all
over the internet we can use the IP address as a randomizer to capture
some fraction of the connections. The example below attempts to capture
about 25% of the connections -- only those connections that have the
last two bits set in the IP address.
yconalyzer
-w
http.pcap -p 80 '(((ip[19:1] & 3) == 3) or ((ip[15:1] &
3) == 3))'
This technique can also be used to randomize using ephemeral
port numbers (either local or remote side)
Analyze:
Classify connections into different buckets
To analyze data in a captured file classifying connections into five
buckets of 2-second duration each:
yconalyzer
-r
http.pcap -p 80 -s 2000
Analyze:
Connections where client sends less than 4K bytes
yconalyzer
-r
http.pcap -p 80 -y 4096
Analyze:
Connections where server sends more than 8000 bytes
yconalyzer
-r
http.pcap -p 80 -X 8000
Analyze:
Percentage of connections that lasted less than 400 msecs
yconalyzer
-r
http.pcap -p 80 -n1 -s400
Analyze:
Details on all connections of duration between 25 and 50ms
yconalyzer
-r
http.pcap -p 80 -n3 -s25 -D25
Frequently
Asked Questions
How
does yconalyzer work?
Yconalyzer gathers the connection control packets of TCP
(i.e. packets that have the SYN, FIN or RST bits set) and presents the
information gathered. User can choose to view connection data using the
different options accepted by yconalyzer. Users may also choose to
capture data using tcpdump. See Introduction.
Why
does yconalyzer perform better than tcpdump?
It does not. It all depends on the filter used when running tcpdump. If
tcpdump is used with a narrow-enough filter, it would perform better as
well! yconalyzer has in-built filter that is narrow enough to take up
minimal amount of CPU. See Performance
Overhead.
Why
is yconalyzer is taking up so much CPU?
Yconalyzer works on the basis that a machine does less of
connection-control activity and more of other activities
(database access, non-connection-control network activity, etc.). Not
all machines are this way, though. As an example, HTTP proxy machines
may not fit this model. In such cases, yconalyzer (or, for that matter,
any packet capture software) needs to work a lot more. See Using additional
filters.
Can I run yconalyzer on a file captured by tcpdump?
Certainly. You can have yconalyzer analyze any file captured by tcpdump -w. You can use the -r option of yconalyzer to analyze the file. See Introduction.
Does
yconalyzer work on UDP-based protocols?
No. UDP does not have packets that clearly mark connection setup and
tear down. Therefore, the only way UDP-based protocols can be analyzed
is by capturing all packets. This may impose a significant performance
overhead, depending on the application. If you have ideas, email me.
Bugs,
Enhancements, Questions?
Please send all bugs, enhancements and queries to the appropriate forum
for TCP
Connection Analyzer.
Appendix I: TCP Basics
Transmission Control Protocol, specified in RFC 793, is a connection oriented protocol. The following diagram represents a typical TCP connection:

Note
that ACK and DATA packets are represented separately in this diagram
for simplicity. ACKs may be piggy-backed on data packets. Read the RFC
for complete details.
TCP uses sequence numbers to identify each
byte sent or received. The SYN packets have the initial sequence
numbers chosen by either end. Each packet sent or received thereafter
(by either side) has (logically) a sequence number identifying each
byte in the packet.
Therefore, capturing packets that have the
SYN or FIN bits set can give us a good bit of information about the
connection, as in:
- Total number of bytes sent by either side
- Connection duration
- Number of attempts for the same connection (if more than one SYN packet is observed)
Yconalyzer uses this information to present information about connections.
